Debugging in Visual Studio Code? Ipdb REPL is still the best.
Why I am writing this blog post? Partially, to shoot out for the VScode developers, partially to document my setup, and mainly to get feedback for my debugging routine. How can I use the current VScode features better for debugging? What am I still ignoring in VScode? What are your tips?
Let me quickly recapitulate for what I am thankful in VScode then I will describe how I debug code. Finally, I will describe my perfect debugging workflow in Ipdb. Can it be replicated in VScode? I don’t know.
UPDATE: Pavel Minaev quickly replied to my comment about a missing feature and recommended VScode Debug Console. The REPL Ipdb equivalent in VScode. I need to test it properly but it seems as functional as Ipdb. 🎉
VScode excellence
-
I was an addicted Vim user because I wanted to focus on the code - on the text. I also fell in love with the keyboard shortcuts’ user experience. Surprisingly, VScode let me focus on code as well. Maximum focus on the text editor, minimal glitter around.
-
Copilot. The game changer. The best for me? I am not stuck and pissed anymore. I have a buddy who I can talk to when I am stuck. I am not frustrated anymore. Just formulating the thoughts to an attentive listener - the Copilot - often helps me to find the solution myself.
-
Extensions - Plugins: The mandatory setup for me was the Vim extension and the SSH extension as I code remotely in the cloud. The Tex, Grammarly, and Python plugins are just awesome additions that ramp the productivity instantly. The setup always felt smooth.
-
The magic of mixing up shortcuts, GUI, and text-based configuration is awesome. Every single time I need to tweak some setup I am amazed at how well the editor config works with GUI and commands. The best part is the Copilot is useful in advising on how to set up VScode itself.
As declared previously not all the workflows are 100% shiny. One such example is the debugging experience
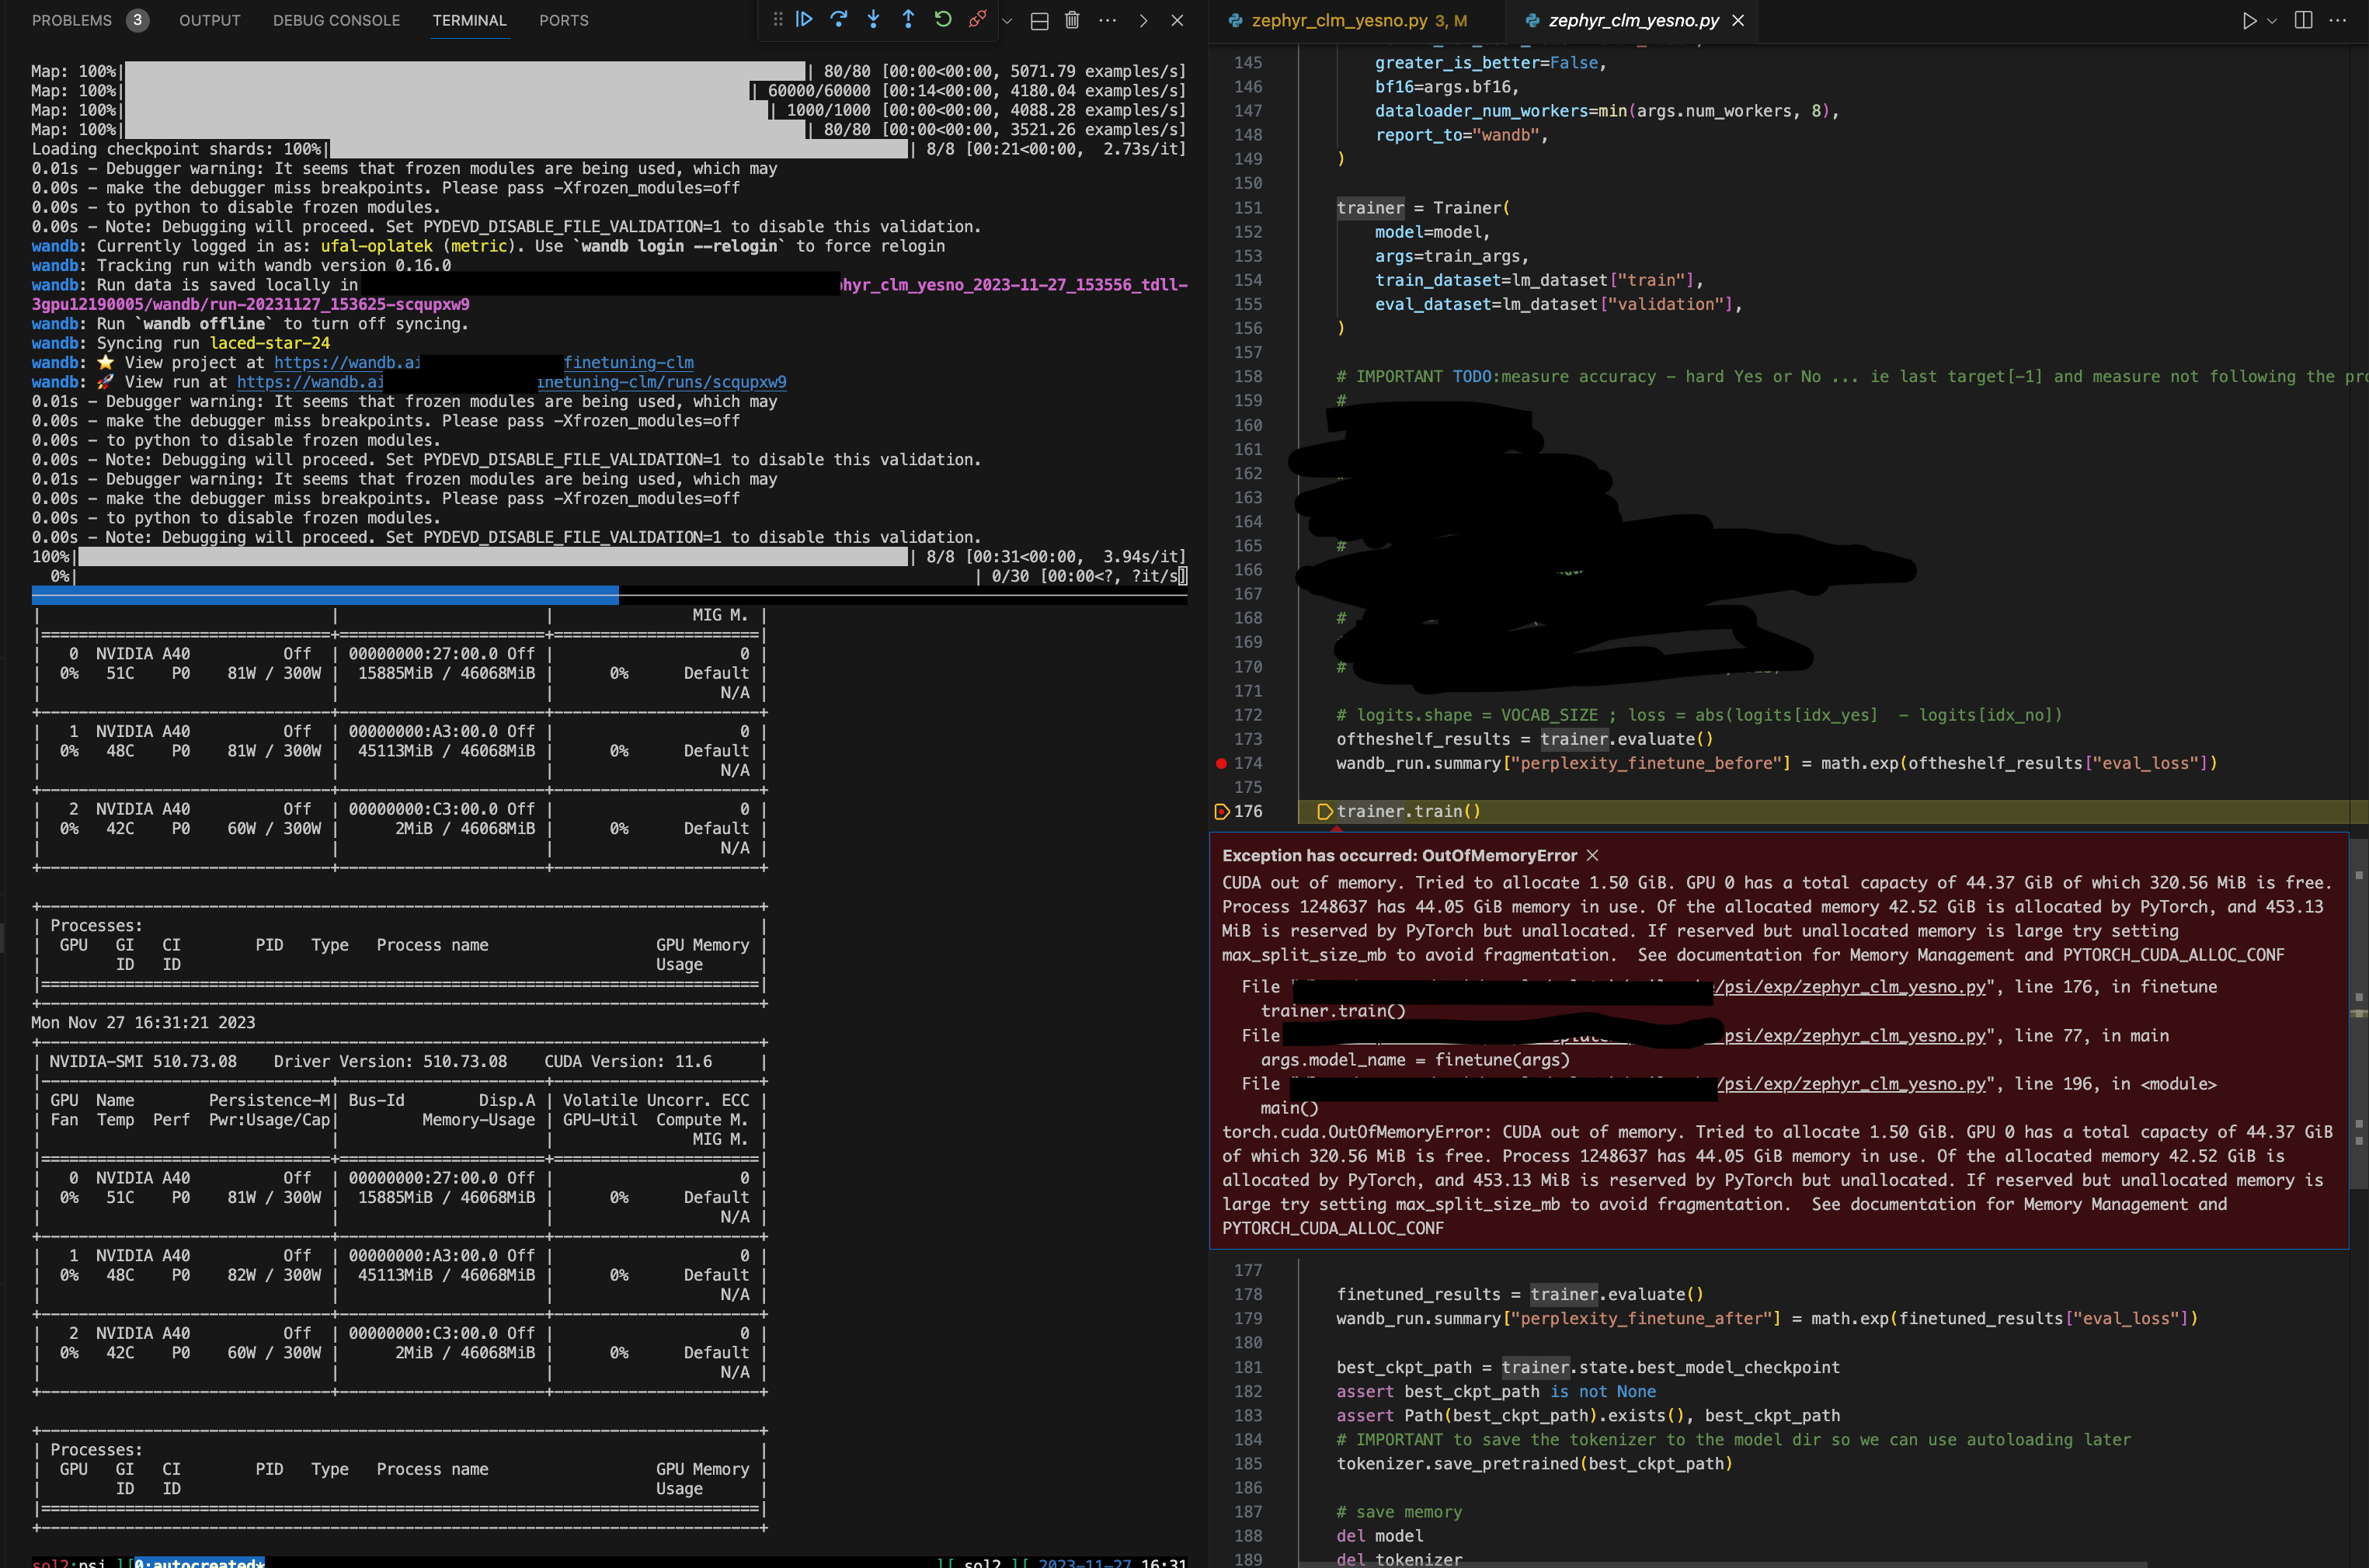
The debugging experience in VScode, what do I do wrong?
Let’s recap my setup. I work on a remote cluster. I log in to the head node of cluster X where VScode is running in remote setup using the SSH plugin. I typically work on GPU since I am training or fine-tuning some models. To obtain a GPU, I log in to a GPU node.
When developing I simply run $ ./train.py from the terminal. However, when debugging I need to create a launch configuration.
I managed to overcome this expected hurdle and I will just share here my launch.json config.
{
    // Use IntelliSense to learn about possible attributes.
    // Hover to view descriptions of existing attributes.
    // For more information, visit: https://go.microsoft.com/fwlink/?linkid=830387
    "version": "0.2.0",
    "configurations": [

        {
            "name": "Python: Remote Attach",
            "type": "python",
            "request": "attach",
            "connect": {
                "host": "tdll-3gpu1",
                "port": 5678
            },
            "pathMappings": [
                {
                    "localRoot": "${workspaceFolder}",
                    // "remoteRoot": "."  // does not work
                    "remoteRoot": "${workspaceFolder}",  // this works on our Slurm FS shared accross sol2 and tdll-3gpu1 nodes
                }
            ],
            "justMyCode": true
        }
    ]
}
Since I want to launch the training script with the same hyperparameters for debugging I attach my debugger to the training script by running the debugpy VScode debugger from a command line in listening mode.
I recently debugged the command ./zephyr_clm_yesno.py --model_name EleutherAI/pythia-160m --max_steps 30 --eval_every_prc_steps 0.8 by simply prepending the debugpy boilerplate python -m debugpy --listen 0.0.0.0:5678 --wait-for-client.
Nice! I can just add a simple prefix in the terminal! 🎉
python -m debugpy --listen 0.0.0.0:5678 --wait-for-client  \
  ./zephyr_clm_yesno.py --model_name EleutherAI/pythia-160m --max_steps 30 --eval_every_prc_steps 0.8

Where is the bad part? There is no bad part, there is just the better part outside of VScode😉. At least for me.
I was used to debugging with Ipdb REPL. The Ipdb command __import__('ipdb').set_trace() at any line will give you a breakpoint at any line of code.
The problem is that you cannot set it up interactively, nor condition the breakpoint on a variable value, nor delete other breakpoints introduced via importing. Not without writing code just meant for debugging which you later need to remember to remove again.
Why is REPL so great? I use it as an interactive Python shell at the place where you need it. In the middle of the program with all the context initialized. I interactively try new solutions to my code at the given call stack. A mighty weapon!🚀
VScode gives me all the other stuff, interactive breakpoints addition/removal, conditional breakpoints but no REPL.😭
Becoming the Ipdb ninja
After giving debugging in VScode a try I returned to debugging with Ipdb for the REPL.
Finally, I was able to figure out a workflow where I could set breakpoints dynamically, delete them and condition them.
Here is the trick. Let’s avoid __import__('ipdb').set_trace() and use -c commands from CLI.
The first line in the Ipbd example below just loads the Ipdb module and starts the debugging process.
The second line sets the first break point to the file psi/utils.py on line 54.
The third line finally does the magic and runs the code until it hits the first breakpoint we have just set.
The fourth line is the command which I run usually without the prefix for debugging with Ipdb. 🚀
python -m ipdb \
 -c "b psi/utils.py:54"
 -c "continue"
 ./zephyr_clm_yesno.py --model_name EleutherAI/pythia-160m --num_workers 0
The rest is easy. Just check the Ipdb cheat sheet. 🚀
Finito, Konec, The end.
Have a great day!
Ondra 🙏🙏🙏
UPDATE2: See VScode Debug Console, no need to implement any new functionality in VScode! Just to learn about the existing one.
Feedback? Tips? Opinion? Share it on LinkedIn ➔
If you want to see more posts like this. Follow me. ➔